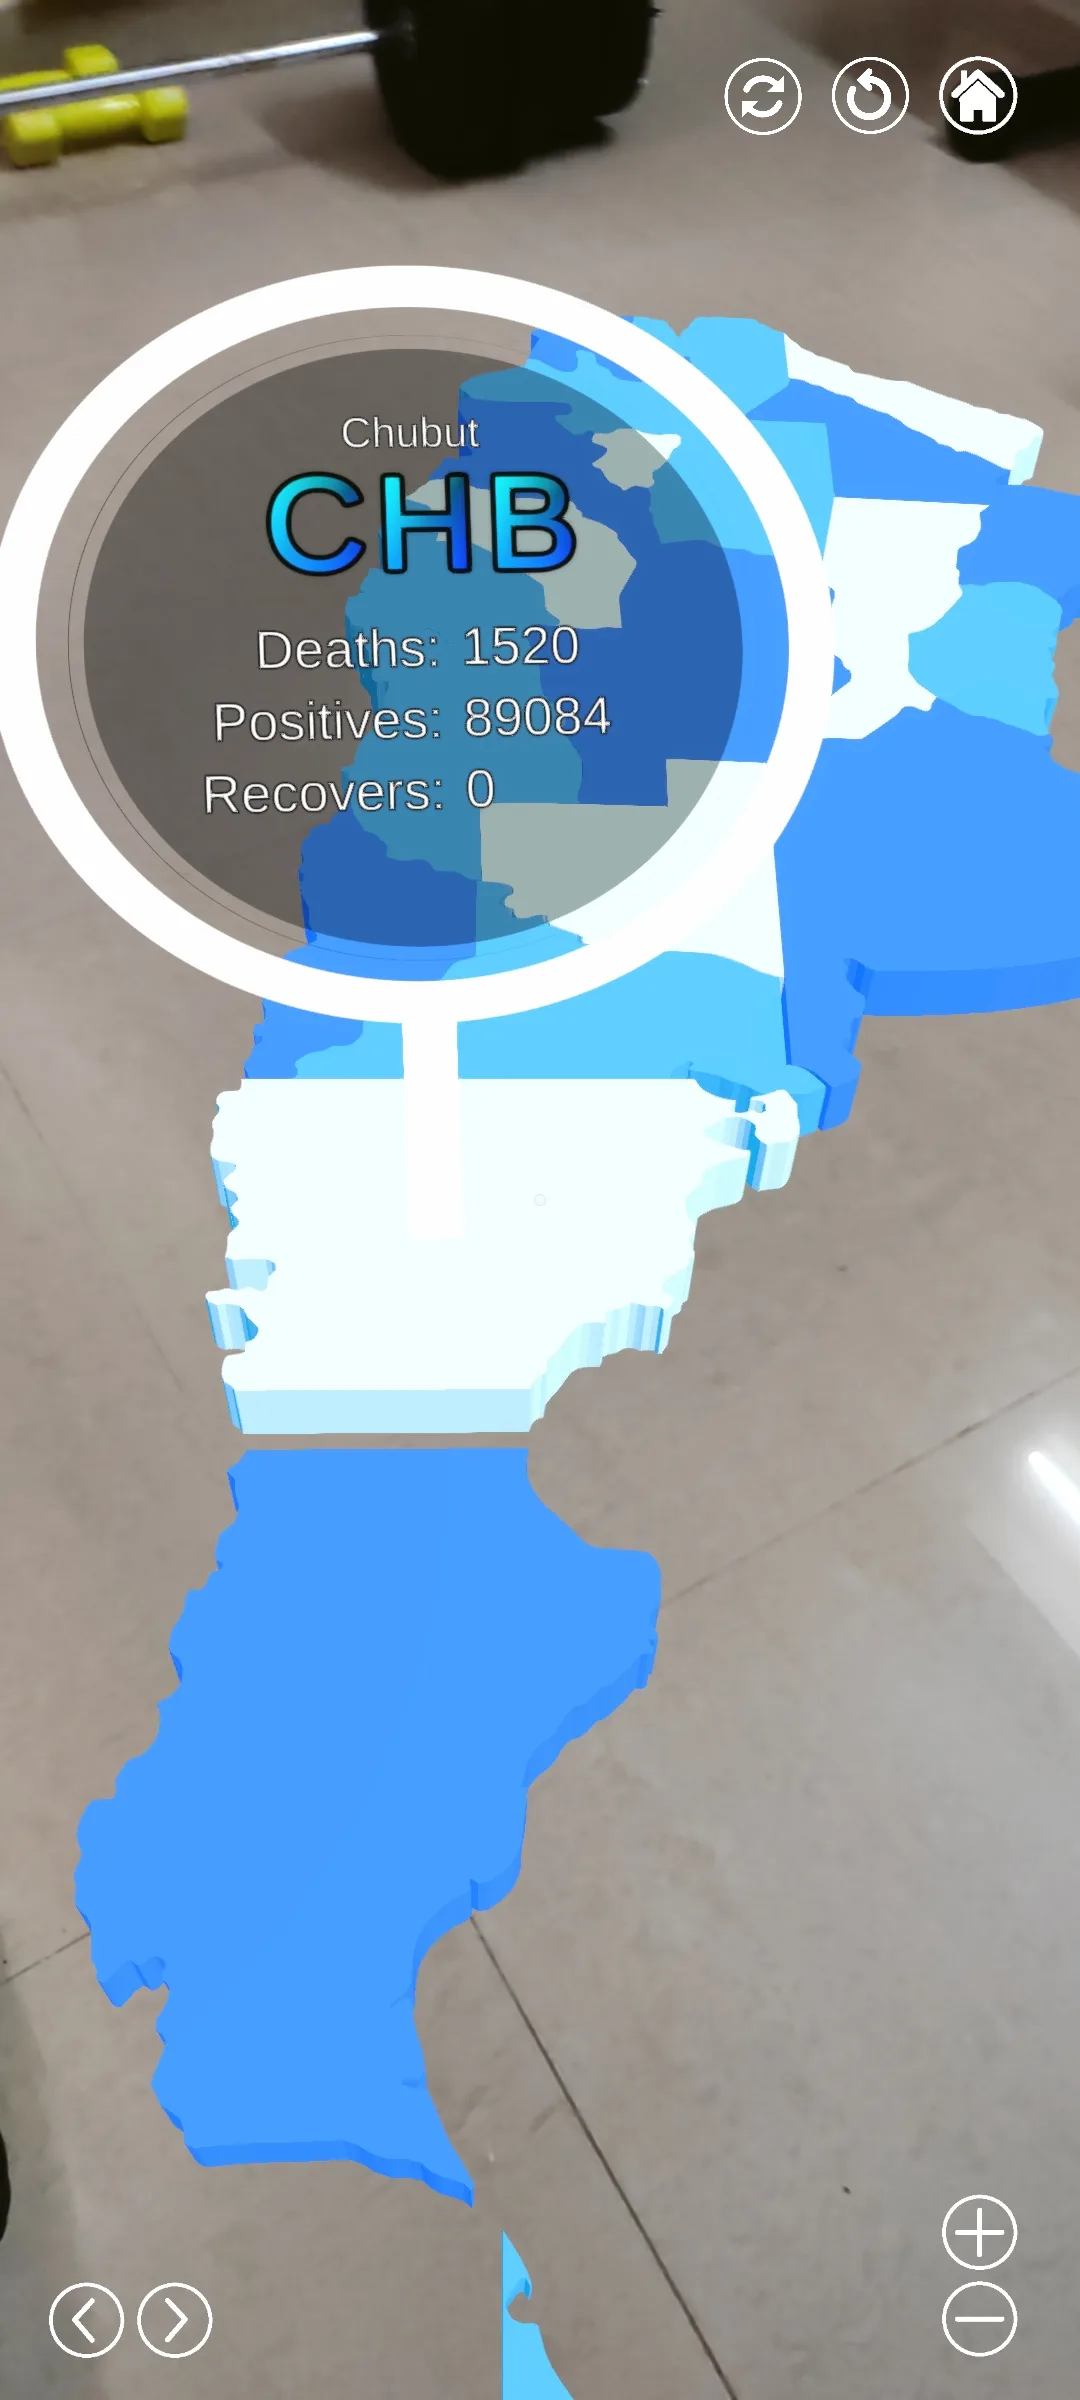
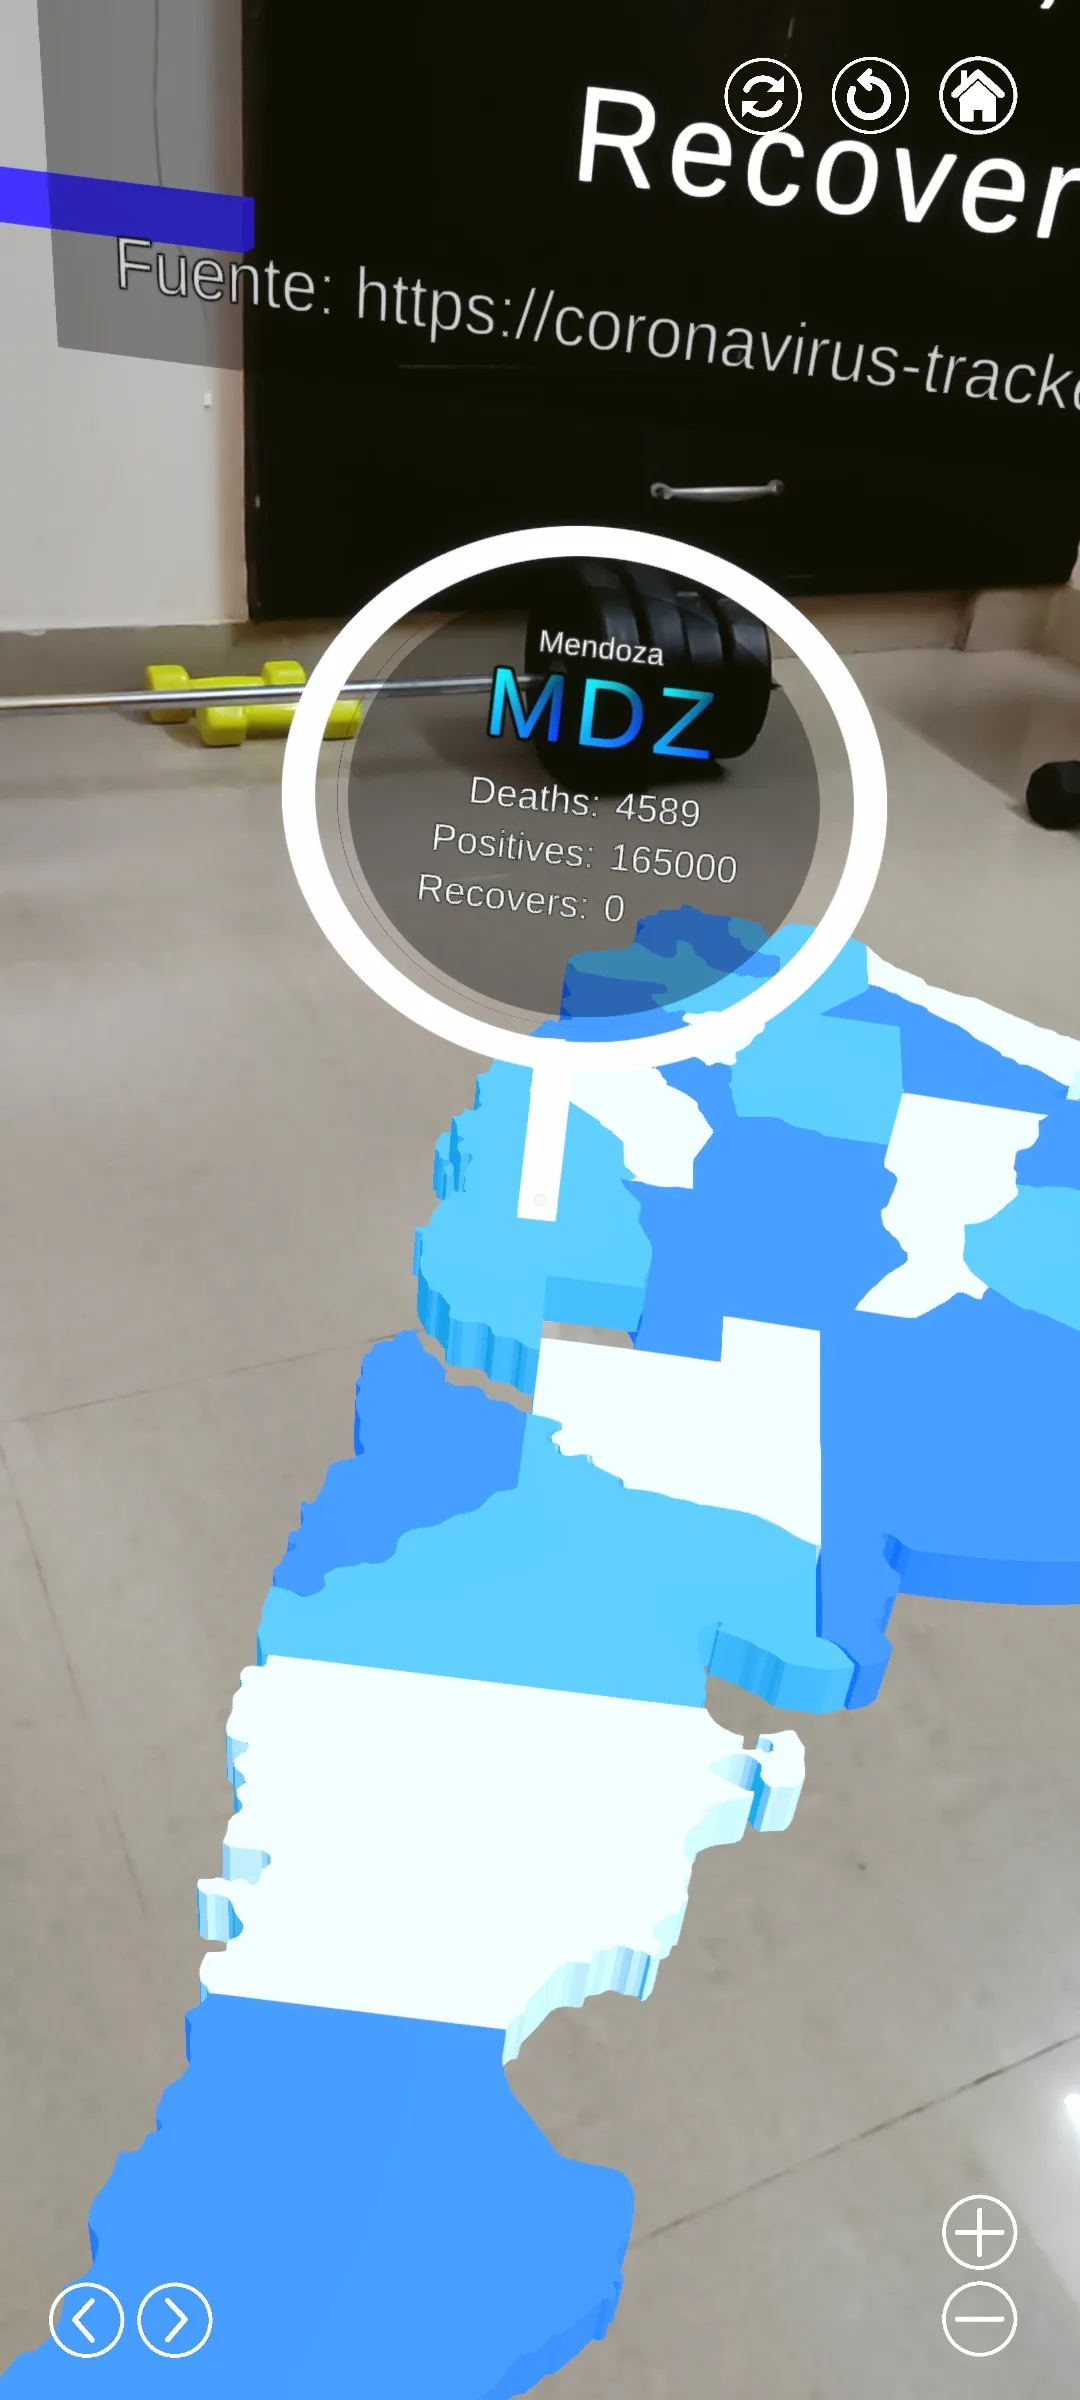
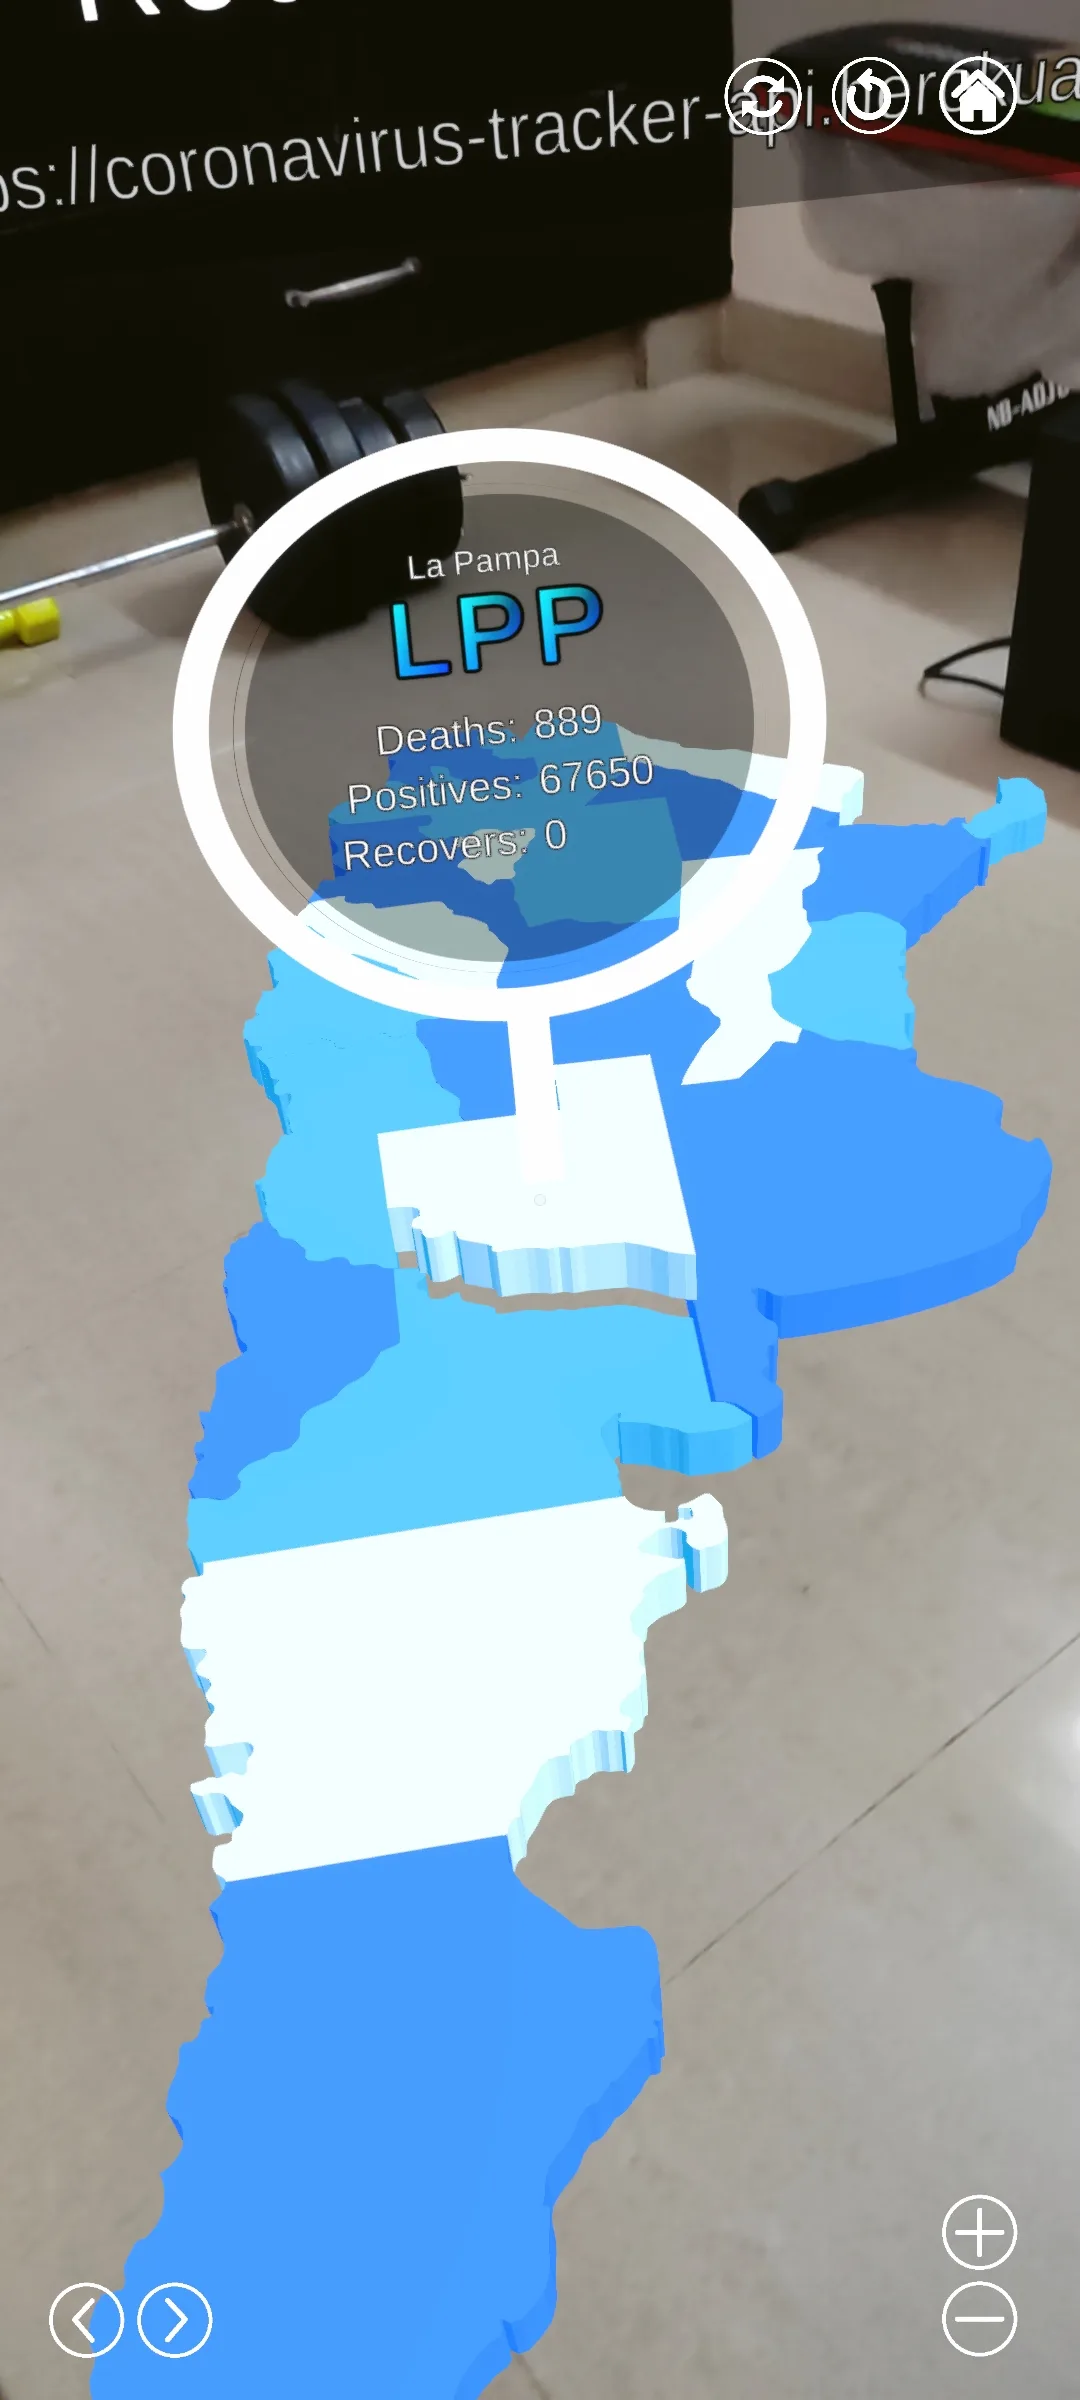
Data Visualization is the most Intuitive approach to depicting the Processed data to the Business Users. This uses various visualization techniques like Graphs, Plots, Tables and many more to show various sets of related data, in a single view to the Business User, so he or she can make an informed decision about their business scenarios.
Augmented Reality has a very important use case that is Data Visualization.
About AR Visualization
Augmented Reality is the concept of the user seeing the reality upon which embedded information is also shown. This is not difficult to imagine. While watching a News Channel, we see the actual video footage (say of the Cricket Field) and on top of it we see Data being shown (maybe of the flight path of the ball). This is the simplest form of Augmented reality.
However, the AR (Augmented reality) in the context of Data Visualizations can get a bit more complex and much more Dynamic in nature. While the camera shows the Image of a particular domain, the domain itself is marked with specific points (either in a Marker or Markerless mode), such that when a particular Point in the Domain is in View of the Camera, the AR system can detect the Specific Point and then become aware of what that Specific Point is.
Example: When the camera is pointed toward a Refinery pipeline, the specific point on the pipeline can tell the AR system that this is a “Crude Oil” carrying pipeline toward the Main Refinery. It will also know based on the GPS coordinates of the “Crude Oil” carrying pipeline.

